
Data note. This case study uses a simulated subscription business, built so that its causal structure is known and can be checked. The figures describe that simulation and are not results from a real client.
The business problem
A subscription software company in the simulation has 58,986 active customers and $2.25bn of annual recurring revenue. It loses 33.9% of customers a year, which is $391m of ARR over twelve months, and net revenue retention sits at 98.9%: expansion nearly covers the leak but not quite. Management doesn't know which accounts are at risk, why they leave, or where to point a finite customer success team.
That is a common situation for a subscription business, and a common first request: "build us a churn model." The more useful question turned out to be a different one.
What the data showed before any modelling
- Usage collapse is an early warning. Accounts with zero logins in a month churned at 16.3% that month, against 2.4% for stable accounts.
- Part of the problem is billing, not product. Accounts reaching two consecutive failed payment cycles churned at 93.6%, and 99.6% of those were involuntary. Involuntary churn was 7.5% of all cancellations. That is the cheapest churn to fix, and it needs a dunning fix rather than a data science project.
- Discounting looked protective but wasn't. Across the whole base, discount band was strongly associated with churn. Once accounts were compared within the same segment, the association disappeared (p = 0.22). Discounts were concentrated in enterprise contracts, which retain better for unrelated reasons. Reporting the headline number would have justified a discount programme that buys nothing.
- Support experience was the most expensive reason to lose a customer. Poor support accounted for $169m of lost ARR, ahead of price ($122m) and champion departure ($118m). Ranking cancellation reasons by count and by revenue gave different priority lists.
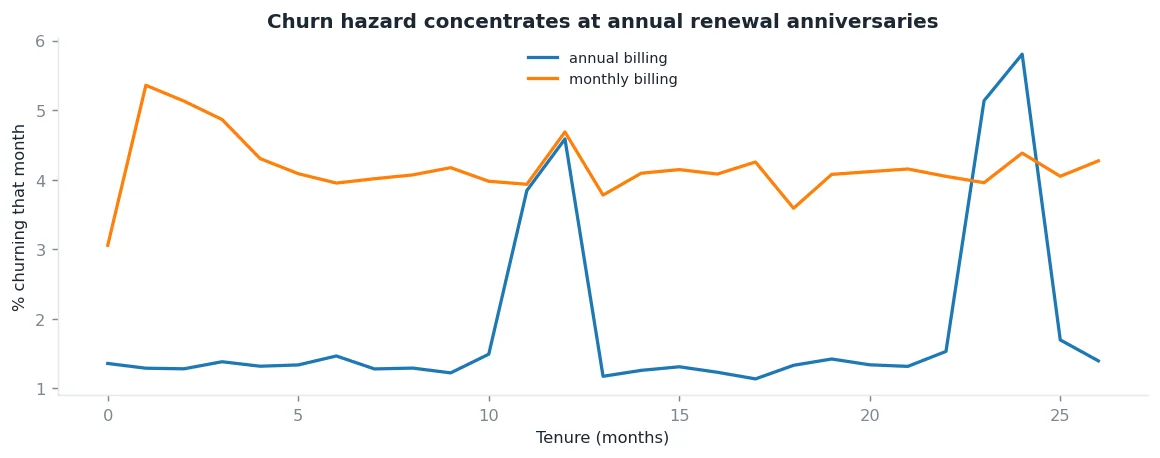
- Risk clusters around renewal dates. Annually billed accounts had almost no churn off-cycle and spiked at months 11–12 and 23–24.
The churn model
I compared three models on one strictly time-based split: train on months up to 25, calibrate on months 26–29, test on month 30 onward. The data had 929,772 customer-month snapshots and a 9.27% positive rate over a three-month horizon.
| Model | ROC-AUC | PR-AUC | Lift at top 10% | Churn captured in top 20% |
|---|---|---|---|---|
| Logistic regression | 0.697 | 0.196 | 2.66× | 44.1% |
| Random forest | 0.714 | 0.219 | 2.86× | 46.4% |
| Gradient boosting | 0.718 | 0.225 | 2.95× | 47.1% |
Why 0.718 and not 0.90. A score near 0.90 on this kind of problem usually means the data is leaking the future. In the simulation the main churn driver is a hidden account-health variable that never appears in any customer-facing table. Adding it back lifted ROC-AUC only from 0.718 to 0.727, which says the model isn't starved of information: most of the remaining error is individual randomness.
Calibration matters when probabilities get multiplied by dollars. Two of the three models were badly overconfident out of the box (expected calibration error 0.363 for logistic regression and 0.298 for random forest). After isotonic calibration fitted on held-out months, all three were at or below 0.004. Using the raw scores would have inflated every revenue-at-risk figure while leaving AUC unchanged, which is a failure no ranking metric detects.
The part that matters: predicting churn is not deciding who to call
The simulation includes a built-in experiment. Each month the customer success team scored accounts with a fixed rule, treated the top 18% as eligible and, because capacity is finite, contacted a random subset of them. Randomisation checked out: none of 69 covariates exceeded a standardised difference of 0.10 between the contacted and not-contacted groups.
The programme worked, but only slightly. The effect on three-month churn was −0.84 percentage points (95% CI −1.28 to −0.40). It was concentrated in SMB accounts (−1.23 pp) and accounts with open support tickets (−0.91 pp), and was statistically null for Mid-Market and Enterprise (−0.15 pp each).
Because treatment was randomised, any targeting rule can be scored on realised outcomes rather than on its own predictions. At a 10% contact budget:
| Rule | Churns prevented per 1,000 contacts | Saved ARR per 1,000 contacts | 95% interval |
|---|---|---|---|
| A. Churn probability | 45.0 | $6.7k | −$374k to +$387k |
| B. Churn probability × MRR | 9.0 | $896k | −$4.43m to +$6.22m |
| C. Predicted uplift | 21.0 | $770k | +$44k to +$1.50m |
| D. Predicted uplift × MRR | 28.0 | $673k | −$2.62m to +$3.97m |
| E. Random | 11.7 | −$88k | −$2.05m to +$1.87m |
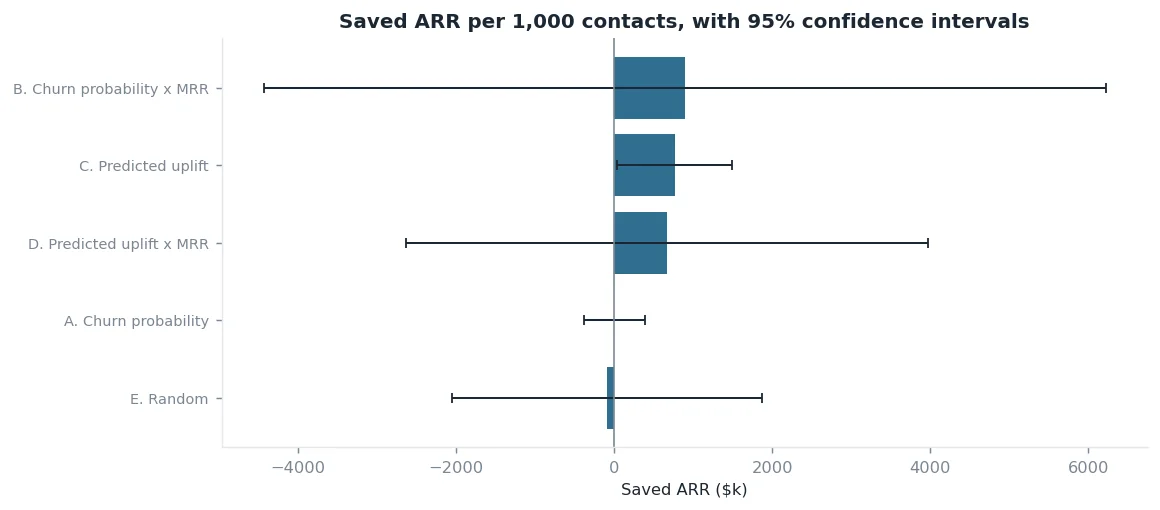
Rule C, targeting by estimated intervention effect, is the only rule whose saved revenue is distinguishable from zero. Rule B, ranking by churn probability times MRR, is the usual revenue-at-risk approach. Its point estimate looks large, but its interval spans roughly ±$5m, because it concentrates the budget on a few very large accounts whose outcomes are volatile and largely unsavable: an enterprise account leaving for a competitor has a high churn probability and almost no response to a call. Rules B and D disagreed on nearly half of the work queue; their top 500 accounts overlapped by only 52.8%.
What I would recommend from this
- Fix involuntary churn through billing operations before spending analyst time on it.
- Time retention effort to renewal windows for annual contracts.
- Target on estimated uplift, and use MRR as a tie-breaker rather than a multiplier.
- Judge any churn model on calibration and on realised outcomes, not on AUC alone.
Limitations
- The data is a simulation. Its revenue scale is high for its customer count, so it behaves like a large enterprise-heavy platform.
- The uplift results rest on the simulated programme's randomised design. On real data the same method needs genuine randomisation or a defensible identification strategy; observational uplift is not reliable.
- Cancellation reasons are stated reasons. They help prioritise but are weak causal evidence, which is why the experiment sits beside them.
How I would apply this to your data
For a real subscription business I would start with the same inputs this project used: subscription history, product usage, billing events and cancellation reasons. The first deliverable is usually the descriptive layer (cohort retention, an MRR movement view that reconciles, churn split into voluntary and involuntary), because it often answers the immediate question before any model is needed. A prediction or uplift model comes second, and only if your data can support it. If you have run retention outreach before, how contacts were chosen decides whether uplift can be estimated at all.
The step-by-step version is in the SaaS churn analysis checklist. The full code, SQL, documentation and a 5,000-customer sample are public: saas-customer-churn-retention-analytics on GitHub.